|
|
|
Our Tech Examples Applications FAQ Index Sales
|

|
Colored Ribbon Cable Inspection from the Cloud |
The ChallengeWAY‑2C's main strength comes from its speed and ease of training, and its ability to reliably identify items with complex shape and/or complex color distributions. However, once in a while we're presented with potential applications where there's no need for training and/or inspection times measured in milliseconds, and where color distributions are relatively simple. Here's one such example. Not long ago we were contacted by an engineer looking for a system to inspect fiber optic ribbon cable during manufacturing. They wanted to insure that the correct number of strands were being included and that all were in the right color order. As initially presented, the need was to continuously monitor the cable during production at a rate of about 500m per minute. Our experiments showed that at this rate one of our traditional camera-based inspection systems could be expected to complete approximately one inspection per meter. Then the engineer reported that there would be no need for such frequent inspection after all, as there was no physical way for the strands to change order once a production run had started. It would only be necessary to inspect once at the beginning of each run. Shortly thereafter, about the time we had proven the feasibilty, we were informed that the need for any automated inspection had disappeared completely. We decided that, whether or not the application was real, a description of the feasibility test procedure and results might be useful to illustrate the versatility of WAY‑2C in such relatively complex color-based identification applications. Not having any fiber optic ribbon in house, we first tested the concept by scanning an available piece of copper ribbon cable with a normal office scanner. The first image on the right, cri_01r2.jpg, is a reduced scale version of that scanned image which we used to train the system to recognize the classes of interest. These were ten strand color classes and a "Margin" class. Actual training was based on scripts automatically created by our standard WAY‑2C Assembly Inspection Package together with a knowledge of the strand count and the specified order of the strand colors. The system was originally conceived as one that could be used either for continuous camera-based on-line inspection, or as a one-at-a-time scanner based system. We recognized that because of the small diameter of optical fiber strands, it might be difficult to consistently maintain ribbon position in the image within a fraction of a strand width. Therefore the inspection needed to be based only on a comparison of the color class determined at each y-location with the expected strand color class order and width but not the exact y position. Also allowance had to be made to handle occasional misclassifications such as might be expected in the binding region between strands. Once the system was trained, we used standard WAY‑2C assembly inspection tools to verify its ability to reliably differentiate the classes of interest. As a final test we inspected the training image itself. One product of the inspection was image cri_01r2_PASS.jpg. It shows the middle of the original image overwritten by color strips, each a single pixel high. The color of each strip is coded to represent the color class most likely to be the source of the underlying ribbon color distribution. It is clusters of such strips that the system uses to determine whether the strand order is correct. The green vertical bar along the left side and "_PASS" in the image name both indicate that no problems have been found during the inspection. A second result of this inspection is the report file cri_01r2.txt confirming that no problems were detected in the ribbon. The same results are also appended to a log file containing the results of all inspections. |
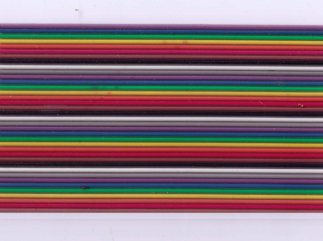
Training Image. cri_01r2.jpg 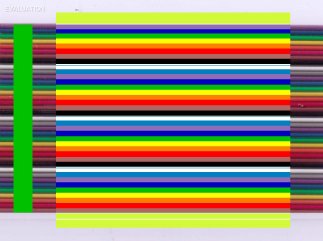
Returned processed training image. cri_01r2_PASS.jpg Report for "Pass" ribbon. cri_01r2.txt |
|
Remote InspectionSince we did not have an actual incorrectly formed ribbon to test, we tried to simulate one. We used a simple image editing program to interchange the red and orange strands in the second color cycle from the top in the training image. To do this we cut out the orange/red strand portion of the image, flipped it vertically, and pasted it back into the region it was taken from -more about this below. On the right is a reduced scale version of the resulting test image (cri_01r3.jpg). This time, instead of inspecting the image using the computer to which the scanner was attached, we scanned it into a Dropbox™ folder shared with a remote server running the ribbon inspection software. The server sensed when a new image was deposited in its shared folder, automatically processed it and then returned the results to the client in the same shared folder. How long did all this take? From the time the scanned image to be inspected was deposited in the client computer's shared folder until the results appeared back in that folder averaged about 20 seconds. Actual time to process the image at the server and generate the response was about a second. To the right are the returned processed image (cri_01r3_FAIL.jpg) and the accompanying text report. The red vertical bar along the left side and "_FAIL" in the image name are hard-to-miss warnings that a failure was detected during the inspection. The short green vertical bar indicates the extent of the "good" ribbon above where the failure was detected. The bottom edge of the bar shows the exact position of the problem. The reported "FAIL" designation and description of the failure: "Invalid color sequence" in cri_01r3.txt were both correct. The location, cycle 2, item 5, was also correct. However, what initially appeared surprising to us were the details of the reported invalid sequence: "Item 5 should be Red but is Brown" did not agree with the error we had intended to introduce, a simple interchange of the red and orange strands. Further careful examination of the test image showed that our editing had been less than perfect. We had actually left what appeared to be a sliver of orange just above the top boundary of the flipped region, and a sliver of brown appearing material just below that boundary. So the inspection system had not only accurately identified where the problem occurred, but also that the failure we had introduced was not exactly the one we intended. Test successful! In addition to verifying correct strand order the system will detect too many and too few strands, and can provide a ribbon width measurement. |
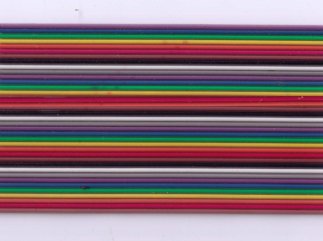
Image to be inspected. cri_01r3.jpg 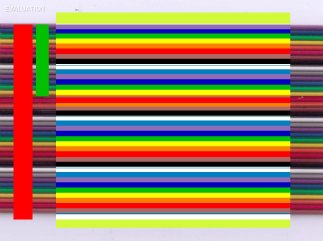
Returned processed image.
cri_01r3_FAIL.jpg Report for "Fail" ribbon. cri_01r3.txt |
|
Inspecting Real FiberHaving verified that the system would work, we tested it on a sample of 12‑fiber ribbon. For this we used a commercial photo scanner at a resolution of 3200 pixels per inch. At this resolution each strand was about 35 pixels wide. The software is set up to be able to select either conventional color specs for 10 colors per cycle with the standard color order for copper ribbon, or the standard color specs for 12 colors per cycle fiber optic ribbon. There is no practical limit on the number of fibers. A reduced scale version of the training image for the colors is shown on the right. Here we used a light bluish green paper background to be easily differentiable from the fiber coating colors. Note that the latter are much more muted (lower saturation) than the vivid copper ribbon colors. To accomodate this we increased the WAY‑2C sensitivity setting a notch. Standard WAY‑2C tools confirm negligible statistical uncertainty in differentiating the color classes. As might be expected, the system found no ribbon faults when inspecting the training image -so we haven't shown its returned processed image or inspection report. Again, without a sample of an incorrect ribbon, we had to resort to image editing to create a test ribbon that would fail inspection. In this case we swapped the "White" and "Slate" fibers. The result is shown as the image to be inspected on the right. Once more, because of the slight tilt of the fibers in the image, our editing was less than perfect. While the software handles this tilt with no problem, the editing introduced the narrow white band detected just below the slate. As shown in the returned processed image, this was detected by the classification step in the inspection software. The order checking portion of the software contains a feature to ignore such very narrow strips. The returned processed image and corresponding inspection report both show that the system has correctly located and properly identified the nature of the problem. We're looking forward to demonstrating the system on a ribbon with many more fibers. |
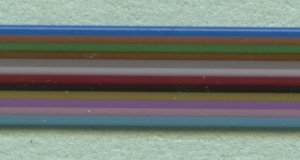
Fiber Training Image. fi1212_1c.jpg 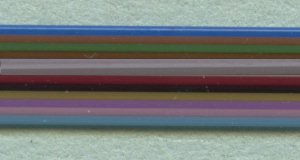
Image to be inspected. "FI1212_1r.jpg
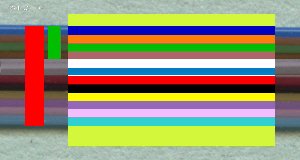
Returned processed image. FI1212_1r_FAIL.jpg Report for ribbon. FI1212_1r.txt |
|
What We've LearnedSo what have we learned? We've learned that for applications of this type, where only intermittent inspections using off-line images are needed, cloud-hosted inspection may be a reasonable option. In this ribbon inspection application, after initial setup, a user can simply:
|
|